| AvaSoft-COL | Color application add-on software, to be ordered with AvaSoft-Full |
| AvaSoft-All | Full version of AvaSpec software, including all application add-ons |
AvaSoft Application Software - Color
For online and offline reflective color measurements, AvaSoft-COL is the ideal companion. This application provides a precise way to perform color measurements using the basic principles and techniques defined by the International Commission on Illumination (CIE). The CIE 1976 L*a*b* color parameters are calculated, along with other parameters, like Hue, Chroma and X, Y, Z.
These parameters can be displayed in a CIELAB chart or in a graph versus time. Another possibility is saving the measured L*a*b* values to an online database and using one of the products from the database as a reference color. Color differences (ΔELab, ΔL*, Δa*, or Δb*) are done by comparing the measured L*a*b* values to the stored database values.
The color of an object can be expressed by the CIE 1976 (L*a*b*) color space. L* describes the brightness of the color. A positive value of a* describes the redness of the color, a negative a* the greenness. Similarly, yellowness is a positive b*, where blue is a negative b*. The L*a*b* values are derived from the CIE tristimulus values X, Y and Z of the sample (object) and the standard illuminant tristimulus values Xn, Yn and Zn.
The standard illuminant tristimulus values for Xn, Yn, and Zn are constant and depend only on the type of standard illuminant that has been chosen.
The CIE tristimulus values X, Y and Z of the color of an object are obtained by multiplying the relative power P of a standard illuminant, the reflectance R (or the transmittance) of the object, and the 1931 or 1964 CIE standard observer functions xn, yn and zn (2 and 10 degree angles). The integral of these products over all the wavelengths in the visible spectrum (380 to 780 nm with a 5 nm interval) gives the tristimulus values.
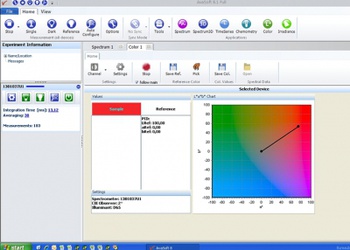
Color chart
The color chart display features:
- Display in CIELAB chart, the actual sample color as well as the reference color with the corresponding ΔELab, ΔL*, Δa*, or Δb* values are displayed and saved as well.
- The settings for the LAB chart display can be changed, such as no graphical display of reference and sample color in order to speed up the measurements.
- The standard observer angle is selectable for 2° or 10°.
- The reference color can be saved to and loaded from a color database. The database contains, apart from all color parameters, a product ID and a display of the actual color. The database can be sorted alphabetically or in either value column.
Time series
The time series display has following features:
- Display in time series can be selected for any number of channels.
- For each channel a color parameter (L*, a*, b*, hue, C, X, Y, Z, ΔELab, ΔL*, Δa*, or Δb*) can be selected. For each channel a different reference color can be selected, enabling color sorting.
- For each channel the time axis can be set to a different scale, allowing simultaneous display of long time and short term monitoring of the same parameter.
- For each channel the actual measured color, as well as the reference color (if in ΔELab, ΔL*, Δa*, or Δb* mode) is displayed.
- The saved time series data can be displayed with extensive zooming and dragging options.